Predicting EPL (English Premier League) Match Results
Table of Contents
Introduction
Data Transformation & Exploration
Methodology Overview
Model Training & Validation
Results
Final Predictions on the Test Set
Conclusion
References
Keywords
1. Introduction
This group project, completed during my undergraduate degree, focused on predicting the outcomes of English Premier League (EPL) matches from Matchday 22 of the 2021-22 season using Machine Learning (ML) techniques.
To tackle this challenge, we developed a pipeline that incorporated both the provided historical match data and a range of additional sources, such as per-player match-time statistics and seasonal player market values. These datasets were merged and cleaned, with feature engineering applied to create informative inputs like shots-on-target ratios and interceptions per opponent pass. Missing data was handled using multivariate imputation with Scikit-Learn's IterativeImputer, and all features were standardized for model training. We then trained regression models to estimate four key performance metrics - expected goals won (xG-won), expected goals conceded (xG-con), defensive pressure (xDef), and offensive effectiveness (xOff). These predictions were used to compute Elo-like scores for each team that evolve over time based on match performance.
Finally, these Elo-like scores served as input to a match outcome classification model predicting whether the result would be a home win (H), draw (D), or away win (A). The final model, a K-Nearest Neighbours classifier, achieved a macro-averaged F1 score of 43.07% using stratified 5-fold cross-validation, comparable to the ~53% accuracy reportedly achieved by bookmakers.
This documentation provides a brief summary of our final report. Both the full report and the code implementation - including data pre-processing, modelling, and predictions - are available in the GitHub repository [1].
2. Data Transformation & Exploration
We began by enhancing the originally provided dataset with richer football data to improve model generalizability. This included match-level passing and possession stats, player performance data, and seasonal market values sourced from platforms like fbref.com and sofifa.com. Data cleaning and standardization were critical steps - team names and date formats were normalized using custom scripts to ensure proper joins. We then aggregated match and player-level stats into team-level metrics, such as average market value and total assists.
Some features, particularly recent ones, contained missing values. We addressed this using multivariate imputation via Scikit-Learn’s IterativeImputer, which models each missing feature as a function of the others to preserve as much data as possible. For feature engineering, we incorporated metrics like shots on target ratio, interceptions per opponent pass, and pressing actions. Feature selection was informed by correlation matrices that helped identify variables contributing most to variance in the prediction targets.
Finally, the dataset was shuffled to avoid temporal bias and standardized using Scikit-Learn’s StandardScaler, which improved model training stability by centring features and scaling to unit variance.
3. Methodology Overview
3.1 Research and Data Gathering
Inspired by established methodologies, the project incorporated advanced football metrics to enrich the original dataset and improve predictive performance. We sourced detailed per-match data - such as passing accuracy, possession stats, and attendance figures - as well as per-player match performance data and seasonal player market values. Match and player statistics were scraped from fbref.com, while valuation data came from sofifa.com. To automate this process, we developed custom scrapers using Python to parse HTML content and export structured CSV files for use in the pipeline.
3.2 Background Reading
The methodology drew significantly from the concept of "expected goals" (xG), as introduced by Corentin Herbinet and Jonathan Passerat-Palmbach [2]. Their approach involved breaking down shots into types (e.g. headers, volleys, free kicks) and training separate classifiers to predict goal probability based on shot angle and distance. These predictions were further adjusted for in-game factors like scoreline, match timing, and player count. The resulting xG values were then combined with non-shot-based metrics—such as possession, corners, and yellow cards—to train an xG regressor. These values were also used to calculate offensive and defensive Elo ratings, which evolved over time and fed into match outcome prediction models.
In parallel, we drew inspiration from FiveThirtyEight’s Soccer Power Index (SPI), which estimates team strength based on preseason ratings and player market values [3]. SPI updates after each match using a mix of expected goal metrics and adjusted goals, and then models the likely match outcome by projecting goals as Poisson processes. Lastly, our research into defensive metrics led us to the concept of “pressing actions” (e.g. interceptions and tackles per pass), one of which we adapted and used to help define our custom defensive metric, xDef [4].
3.3 Prediction Strategy
Our predictive approach centred around the development of Elo-like ratings derived from team-level performance metrics predicted by regression models. All models were implemented using Scikit-Learn, chosen for its wide adoption and excellent documentation, which allowed us to iterate quickly and stay focused on experimentation.
We began by testing a simple multi-class classification model—a Linear Support Vector Classifier (LinearSVC)—on the provided training dataset. While it performed exceptionally well in training (macro-averaged F1 score of 97.36% across 5 stratified folds), this result revealed severe overfitting, prompting us to rethink the architecture of our predictive pipeline.
Inspired by the methodologies of Corentin Herbinet and FiveThirtyEight, we shifted focus to predicting granular match-level metrics instead of match results directly. We trained two Linear Support Vector Regressors (LinearSVR) to predict a team’s expected goals won (xG-won) and expected goals conceded (xG-con), using features derived from the team's own stats as well as those of their opponent, including mean player market values. To push this further, we developed two additional regression models using ElasticNet to predict a defensive metric (xDef), defined as interceptions per opponent pass, and an offensive metric (xOff), defined as the proportion of shots on target.
Each of the four metrics - xG-won, xG-con, xDef, and xOff - was used to generate an individual Elo-like rating for each team. These ratings were updated after every match based on actual versus expected performance, following a formula similar to traditional Elo systems.
To emphasize recent form, we introduced a temporal weighting mechanism into the update process - especially for the xG-based ratings - where the update factor (K) decayed over time, giving more weight to recent matches. Meanwhile, xDef and xOff used fixed update factors to maintain rating stability (See full report for exact formulas).
Once all Elo ratings were updated post-match, we used the most up-to-date ratings as features to train a multi-class classification model. Specifically, we used a K-Nearest Neighbours (KNN) classifier to predict whether the match result would be a home win (H), draw (D), or away win (A). This classifier, trained on pre-match Elo scores for each team, was then used to predict the outcomes of the ten EPL matches scheduled for January 15, 2022.
3.4 Alternative Approaches
We considered several alternative strategies but ultimately discarded them due to underperformance. One early idea was to use a single multi-class classifier trained directly on the original features to predict match outcomes. However, this approach suffered from severe overfitting and was quickly abandoned.
We also tested Principal Component Analysis (PCA) to reduce feature dimensionality, but it led to worse performance - likely due to non-linear relationships in the data. Finally, we explored adding separate home and away Elo scores for each predicted metric, but this had little to no benefit and made the model more complex, so we opted to keep the Elo ratings unified.
4. Model Training & Validation
Our initial models - LinearSVR for regression and LinearSVC for classification - were chosen for their simplicity and quick training times, allowing us to build baseline pipelines and iterate rapidly. To improve model performance, we explored hyperparameter tuning using both GridSearchCV and RandomSearchCV, eventually favouring grid search during development for its consistency and ease of debugging. Later, we adopted Bayesian Optimization through BayesSearchCV from the scikit-optimize package, which allowed for more efficient exploration of the hyperparameter space across a wide range of models. Although tree-based regressors like XGBoost and Random Forests achieved the highest R² scores during cross-validation, they produced implausible Elo scores and degraded final classifier performance, likely due to overfitting. Instead, we found that LinearSVR produced the best results for xG-won and xG-con when combined with our overall pipeline. For the xDef and xOff regressors, ElasticNet performed best among non-tree-based models, offering a strong balance between feature selection and regularization. These choices helped ensure stable Elo updates and interpretable model behaviour.
To evaluate model performance, we used the R² score for regressors and the macro-averaged F1 score for the final match outcome classifier. Macro-averaging was important in our case because class labels (home win, draw, away win) were relatively balanced, and this metric equally weighs precision and recall across all classes. All evaluations were carried out using stratified 5-fold cross-validation to ensure balanced splits and to prevent overfitting. This method also provided more robust performance estimates by validating across multiple subsets. We chose five folds as a standard compromise between performance and runtime efficiency.
5. Results
The model development followed an iterative process, with each step informed by performance evaluations and feature experimentation. Early attempts using a direct classification model (LinearSVC) heavily overfit the training data, achieving an inflated macro F1 score of ~97% due to lack of generalisation. This motivated a shift toward a regression-driven approach using Elo-like ratings.
Incorporating scraped passing and attendance data slightly improved generalisation. However, a major boost came from adding granular per-player performance data and seasonal player market values. These additions significantly enhanced the regression models’ R² scores, especially for xG-won and xG-con, which both exceeded 0.88 in the final version. Experimenting with additional Elo scores specific to home and away matches ultimately hurt classifier performance and was discarded in favour of a simpler, unified approach.
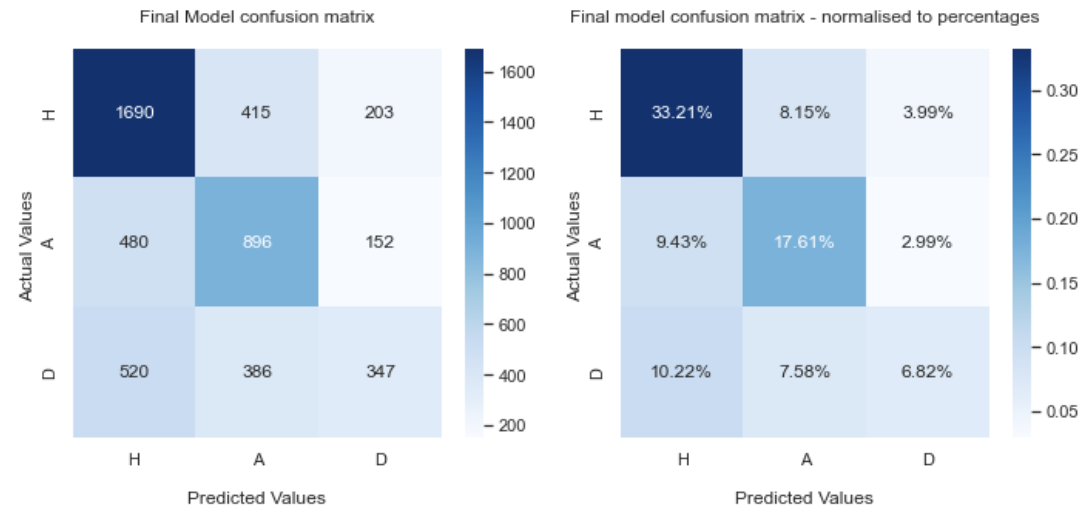
The final setup used LinearSVR for xG-won and xG-con, and ElasticNet regressors for xDef and xOff. These predicted metrics were converted into dynamic Elo scores, which served as inputs to a K-Nearest Neighbours (KNN) classifier. This model achieved a macro-averaged F1 score of 43.07%, a competitive result compared to bookmaker baselines (~53% accuracy), with consistently low standard deviations across cross-validation folds.
Full regression and classification metrics, including R² scores and additional classification statistics like precision, recall, and Jaccard index, are detailed in the final report.
6. Final Predictions on the Test Set
The table below presents our model’s predictions for the 10 English Premier League fixtures from Matchday 22 of the 2021-22 season. The model correctly predicted the outcome of 6 out of 10 matches, yielding a final prediction accuracy of 60%.

D represents a draw; and H and A represent the home and away teams winning, respectively.
7. Conclusion
Despite inherent limitations such as player transfers, data scarcity, and computational constraints, our predictive framework demonstrated notable effectiveness, achieving a macro-averaged F1 score of 43.07%. This is a strong result considering the restricted availability of high-quality football data and is comparable to the ~53% accuracy of professional bookmakers.
Several opportunities remain for improvement. The January transfer window, for instance, may have introduced inaccuracies due to shifts in team compositions, suggesting the need for mechanisms to adjust for such changes. Additionally, while Elo ratings provided a compact representation of team strength, there may be limits to how much information can be encoded into a few numeric values. Future iterations could incorporate non-Elo-based features into the classifier, include a broader set of performance metrics for xDef and xOff, and explore more sophisticated approaches like recurrent neural networks to better capture temporal dynamics [5].
Overall, the approach offers a modular and interpretable solution that balances statistical rigor with practical constraints, and sets the stage for further experimentation and refinement.
8. References
[1] GitHub Repository with the full report & Jupyter notebook
[2] Corentin Herbinet. Predicting football results using machine learning techniques. MEng thesis, Imperial College London, 2018.
[3] FiveThirtyEight. How Our Club Soccer Predictions Work. Aug. 2018
[4] Colin Trainor. Defensive Metrics - An Introduction. Oct. 2013
[5] Dwijen Rudrapal et al. “A Deep Learning Approach to Predict Football Match Result”. In: Jan. 2020, pp. 93–99. ISBN: 978-981-13-8675-6. DOI: 10.1007/978-981-13-8676-3_9.
9. Keywords
Tools & Technologies: Python, Jupyter Notebook, Pandas, Scikit-Learn, scikit-optimize, LinearSVR, LinearSVC, ElasticNet, K-Nearest Neighbors (KNN), IterativeImputer, BayesSearchCV, GridSearchCV, RandomSearchCV
Tags: Elo Rating System, Machine Learning, Regression, Classification, Feature Engineering, Football Match Prediction, English Premier League (EPL), Cross-Validation, Stratified K-Fold, Data Imputation, Hyperparameter Tuning, Model Selection, Macro-averaged F1 Score, Micro-averaged F1 Score, Coefficient of Determination (R²), Bayesian Optimization